
An AI feature can return a response in two seconds and still be impossible to operate. Was the time spent in the model, a retrieval step, a slow internal API, or an agent retrying a tool call? Did a model change increase token use? Did one workflow begin selecting an unexpected tool? A conventional request trace may show that work occurred. It often does not say what the work meant.
That is the problem addressed by semantic observability: instrumenting a system with telemetry that names meaningful domain operations, rather than merely recording transport details. For GenAI applications, the relevant operations include model interactions, agent invocations, retrieval, tool execution, conversations, outputs, and token consumption. OpenTelemetry is moving its GenAI attributes into a dedicated semantic-conventions repository, while documenting conventions for spans, metrics, events, clients, MCP, and provider-specific instrumentation. The vocabulary is already in use, but remains under active development. OpenTelemetry’s documentation and repository make that evolution explicit.
Plain English: A trace should not just tell you that your app made five network calls. It should tell you that an agent chose a tool, the tool failed once, a model was called again, and the response used a particular number of tokens.
The missing vocabulary in ordinary traces
A trace is a connected record of work performed for one request or job. It consists of spans, which are timed operations linked by parent-child relationships. Distributed tracing is already excellent at answering questions such as “which service made this database call?” It relies on context propagation: passing identifiers through service boundaries so independently emitted records can be joined later.
Those mechanics are necessary for AI systems, but they are not sufficient. If every operation is merely called POST /generate or HTTP client request, a backend can measure duration but cannot reliably distinguish an agent decision from a model call, a retrieval lookup, or tool execution. Nor can it aggregate token use consistently if each SDK invents different field names and units.
OpenTelemetry semantic conventions add that missing layer. They define shared names and expected meanings for telemetry fields. The documented GenAI vocabulary includes agent and conversation identifiers, operation names, providers, requested and response models, output types, finish reasons, token-related attributes, retrieval data, and message-content fields. The GenAI attribute registry is therefore more than a reference for naming fields: it is an interoperability contract for the questions an operations team expects to ask.
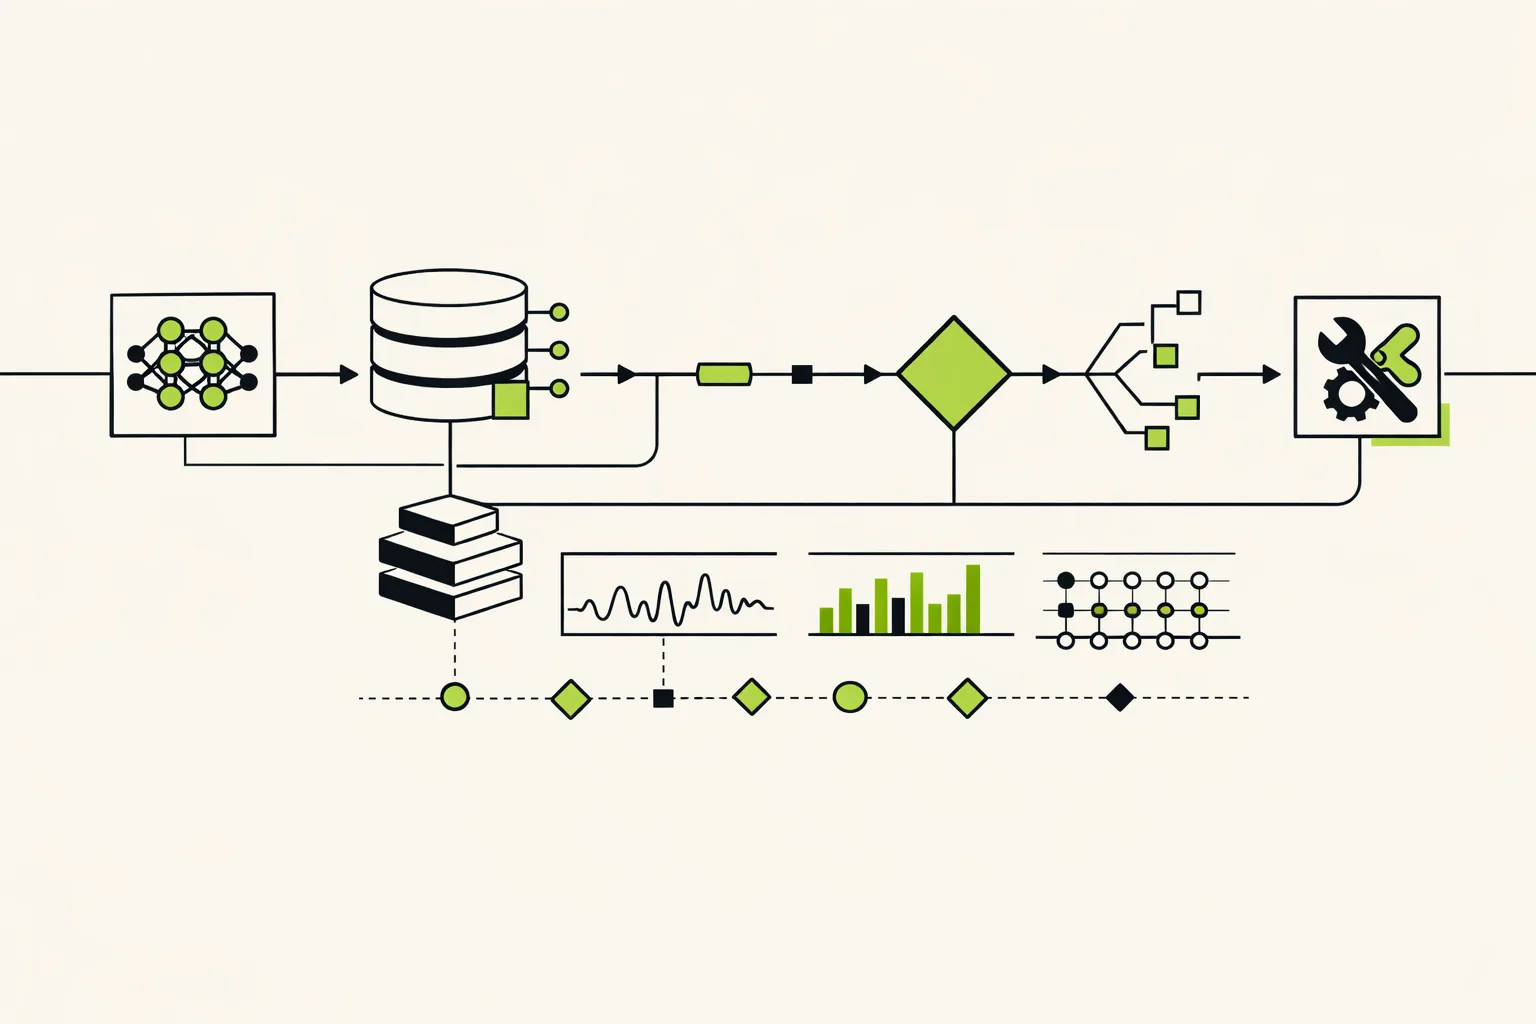
Why does this matter now? AI applications are increasingly workflows, not single model requests. A user request may cause an agent to assemble context, call a model, invoke a Tool, inspect the result, then call another model or service. OpenTelemetry’s walkthrough represents that shape with agent-invocation, model-call, and tool-execution spans, and attaches model identity and token usage as semantic attributes. The walkthrough shows why one undifferentiated “AI request duration” number is not enough.
How the model works, step by step
Start with the business operation, not the telemetry vendor. Consider an internal support assistant that answers a question about a customer account. The root span represents the incoming request. Its child operations are not generic HTTP names; they describe the workflow: agent invocation, retrieval, model interaction, and perhaps a CRM lookup through a Tool.
Each operation records duration, status, parentage, and carefully chosen semantic attributes. The agent span can identify the agent and conversation. The model span can identify the provider, requested model and response model, output type, finish reason, and input and output token figures. A retrieval span can identify its retrieval operation and relevant metadata. A Tool span describes the execution distinct from the model deciding to call it. These fields turn a tree of timings into a causal account of the workflow.
The trace preserves individual-request detail. Metrics, derived from the same vocabulary, provide the fleet view: model latency by provider, output tokens by agent, tool-error rates by operation, or workflows with unusually many retries. The practical gain is consistency. When one service uses model A and another moves to model B, dashboards do not need to infer meaning from provider-specific payload shapes if both instrumentations map their data into the same semantic terms.
Telemetry normally travels in a common protocol, OTLP, from application instrumentation through collectors to an observability backend. OTLP does not make the data meaningful by itself; it carries what the instrumentation emits. Semantic conventions are the agreement that lets a compatible backend recognize the meaning of an operation without needing to understand every provider API.
Plain English: OTLP is the delivery format. Semantic conventions are the labels on the package. You need both if you want different tools to interpret AI telemetry in roughly the same way.
Content is a separate design decision. Prompt text, system instructions, tool arguments, and tool results can be very useful during an incident, but may contain credentials, personal data, customer records, or other regulated material. In OpenTelemetry’s example, prompt and Tool content are not captured by default because of that risk; content capture is enabled explicitly when needed. That default is a useful operational posture: record stable metadata broadly, then make sensitive content collection deliberate, restricted, and auditable.
What semantic observability is not
It is not a promise of model quality. A trace can show that a model returned quickly, used few tokens, and made no failed Tool calls. None of that establishes that its answer was correct, safe, relevant, or useful. Evaluation is the separate practice of judging outputs against a rubric, test set, policy, or human review. Execution records can supply evidence to an Evaluation system, but telemetry alone cannot detect hallucinations or prove that retrieved documents were relevant.
It is also not just logging prompts and responses. Raw logs may be indispensable, especially during debugging, but they tend to lack consistent operation boundaries, causal links, and typed attributes. They can also become an uncontrolled copy of sensitive user content. Semantic observability can include selected content where policy permits, but its core is structured, linked metadata.
Nor is it a replacement for vendor tools. Provider-specific observability products can have useful capabilities and may expose details that a shared schema does not yet cover. The trade-off is coupling: dashboards, alerts, and queries can become dependent on one vendor’s event model. A shared vocabulary does not erase those product differences, but it gives your own instrumentation a portable baseline.
Finally, it is not a finished, immutable standard. OpenTelemetry says its GenAI conventions are actively developing, and the dedicated repository continues to define the relevant span, metric, and event conventions. The project’s status is a reason to version your telemetry contract and isolate mappings in instrumentation code—not a reason to wait for perfection.
A realistic engineering example
Imagine a production service that helps support staff answer, “Why was this invoice adjusted?” The request starts an agent workflow. The agent retrieves relevant invoice and policy records, asks a model to summarize the evidence, and may use a billing Tool to fetch one missing detail.
Without meaningful spans, an on-call engineer sees a slow request and a handful of SDK calls. With semantic observability, they can follow the root request into an agent invocation, see that retrieval was quick, observe that the first model call completed, and discover that the billing Tool was retried twice. They can then inspect whether the model call’s token use grew compared with the usual workload, whether a particular provider or response model is involved, and whether a finish reason clusters with failures. This is diagnosis, not guesswork from a single latency graph.
The design does not require recording invoice text or customer messages in every trace. The team can first emit identifiers, model and operation metadata, token counts, timing, outcomes, and carefully bounded error information. If an approved incident workflow needs content, it can enable narrowly scoped capture with access controls and retention rules rather than silently putting all prompts into a general log sink.
Be careful with high-cardinality data: attributes whose values vary almost every request, such as conversation IDs, arbitrary prompt IDs, or detailed model-version strings. High cardinality can increase storage and query cost, and it can make broad metric aggregation less useful. Keep per-request identifiers where trace correlation needs them; do not casually turn every identifier into a metric dimension. Cardinality is an operational cost choice, not an implementation footnote.
Plain English: Put unique IDs in traces when they help you investigate one request. Do not automatically group every dashboard by them, or your telemetry bill and queries may become harder to manage.
Where it breaks
The most common failure is superficial instrumentation: wrapping an SDK but emitting only a duration and a provider name. That produces a prettier timer, not a usable model of an agent workflow. Decide which operations matter before implementing spans, then make their boundaries stable across services.
A second failure is treating a shared schema as if it normalized reality. Different providers can have different tokenization, pricing, latency behavior, request formats, and model semantics. The conventions make fields comparable in meaning where possible; they do not make providers identical. Keep raw provider-specific diagnostics available in controlled places when they are necessary, while using the common fields for cross-system reporting.
A third is over-collecting. Capturing message content everywhere creates privacy, security, and retention obligations that can outweigh debugging value. Conversely, metadata-only telemetry will sometimes leave an incident unresolved. The right answer is neither “log everything” nor “never record content”; it is a tiered policy that states what is collected by default, who can enable more, where it is stored, and when it is deleted.
What a senior engineer can do this week
First, draw one real AI request as an operation graph. Name the root request, agent invocation, model interactions, retrieval steps, and Tool executions. If an operation cannot be named clearly, the application boundary may be unclear too.
Second, write a small telemetry contract around the stable fields your team needs: operation name, agent or workflow identity, provider and model identity, outcome, duration, token use, and retry or error signals. Align it with the current OpenTelemetry GenAI conventions where they fit, and keep the provider-to-convention mapping behind a narrow adapter.
Third, decide on content handling before rollout. Separate metadata needed for ordinary operations from sensitive content needed only for exceptional diagnosis. Review retention, access, and redaction with the people responsible for your data policy.
Finally, use traces and metrics to establish operational questions before building elaborate dashboards: Which component dominates p95 latency? Which workflows retry tools? Which model or agent drives token growth? Then add separate Evaluations for answer quality and safety. A system becomes observable when it helps engineers explain behavior; it becomes trustworthy only when operational evidence and quality evidence are both present.